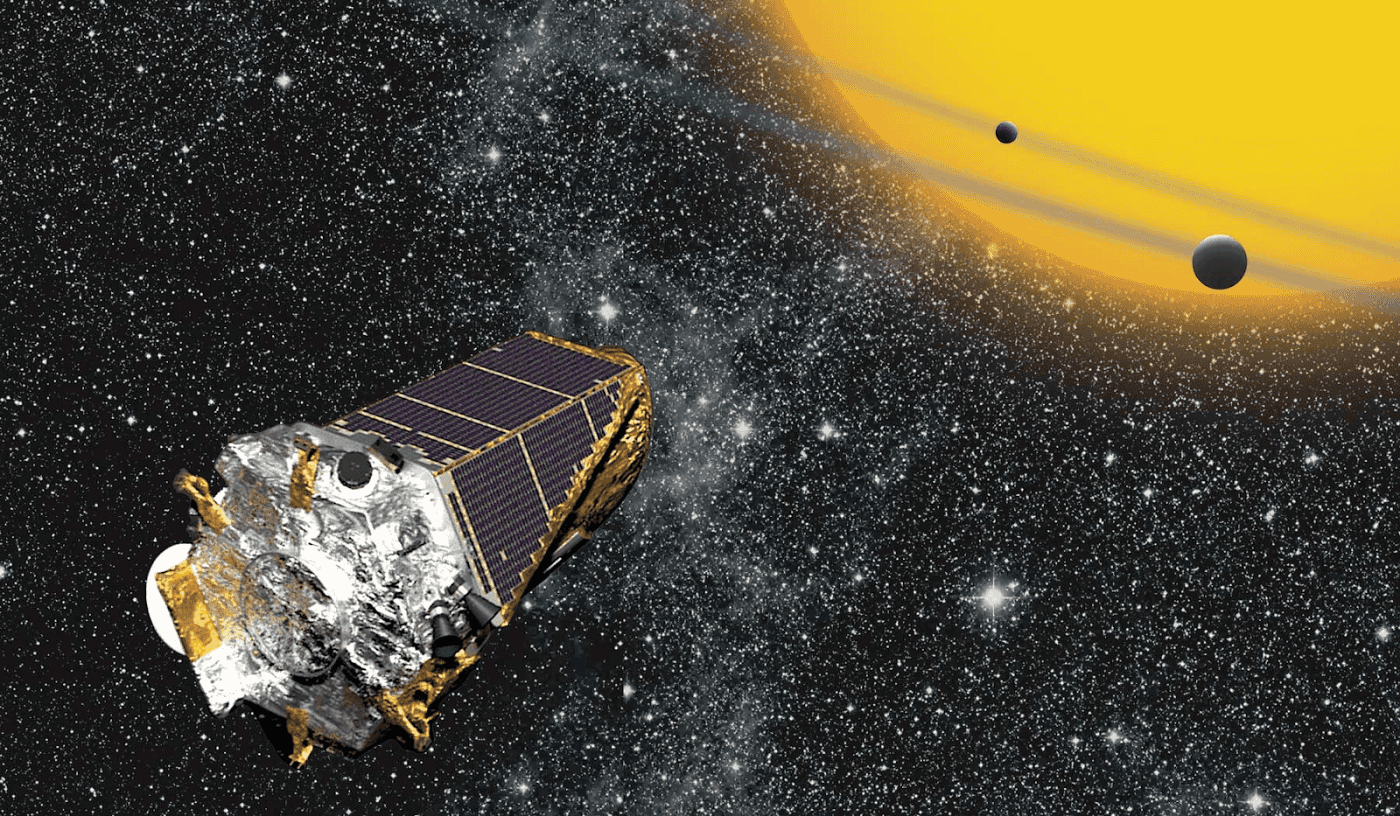
Exploring Machine Learning with the Kepler Telescopes
by Luke Rivers (Project Lead), Ashley Lu, Ben Brill, Hyerin Lee
Introduction
We have all wondered at one point or another whether there is life out there in the universe, or if we are alone. The Kepler mission is a step in finding out the answer to that question. The Kepler telescope was launched in 2009 with the goal of identifying exoplanets orbiting other stars, some of which could be in what is referred to as a ‘habitable zone’ in which temperatures are similar to Earth and could therefore have liquid water and potentially support life.
The Kepler telescope follows a heliocentric orbit, meaning instead of orbiting earth it orbits the sun. As opposed to most other astronomical telescopes the Kepler telescope stays focused on one patch of sky for years on end, and has a wide viewing angle of around 10 degrees by 10 degrees. That is comparable to the amount of night sky that is covered by your hand at arm’s length. That area contains an estimated 6.5 million stars, of which roughly 1–10% are likely to contain planets that orbit on a plane at which they can be detected by the telescope. In the nine years of its operation, Kepler identified over 2600 planets outside our solar system. So how does the telescope identify planets?
How the Telescope Works
Imagine that you’re watching a movie from a projector. When a person passes in front of the projector, it creates a shadow and blocks part of the light that’s coming out of the projector. From the perspective of the audience, besides being annoyed, they can see that part of the light from the projector was blocked because of the person passing in front of it. What the audience did is very similar to what the Kepler telescope does: it spots the exoplanets orbiting the stars by detecting the subtle change in the amount of light from the star when a planet passes in front of a star, a phenomenon called transit.
The change in the star’s level of light can be plotted on a graph, which would show a regular dip that corresponds to a transiting planet. This graph is called the light curve, and it tells us a lot of information about the planet. When the light curve is plotted over a long period of time, we can measure the length of time between transits to determine the orbital period of that planet — the time it takes for a planet to complete one orbit around the star. We can also measure the transit depth, which is how much a planet dims the light of the star. Transit depth can be used to estimate the size of the planet: the higher the transit depth is, the larger the planet since a bigger object would block more light. The curve also tells us the transit duration, which is how long a planet takes to transit, shown by the length of time of the dip in the light curve. It gives information about the distance of the planet from the star. Greater distance would cause a planet to take longer to orbit the star, meaning the transit duration would also be longer.